
emmtrix
Performance
Estimator (ePE)

Know Your Code’s Runtime – Without Running It
The emmtrix Performance Estimator (ePE) uses static performance estimation to provide detailed insights into the runtime behavior of C code without executing it. It can be applied early in the development process and at any later stage as well, typically delivering results up to six months ahead of a standard automotive HIL setup.
The analysis runs within minutes on the developer’s PC or can be integrated into a continuous integration (CI) system. The determined execution times are deterministic, providing consistent and reproducible results. In contrast, measurement-based approaches can be influenced by non-deterministic runtime effects. This enables automated performance tracking, continuous monitoring of timing budgets, and the evaluation of runnables or SWCs before full system integration.
ePE also integrates with code generated by TargetLink or Embedded Coder. Its static approach allows even small code fragments to be analyzed without measurement overhead. Performance information can be related back to the Simulink block level, giving function developers detailed insight into the timing behavior of their models, including during early development phases.
emmtrix Performance Estimation Workflow for C-Code
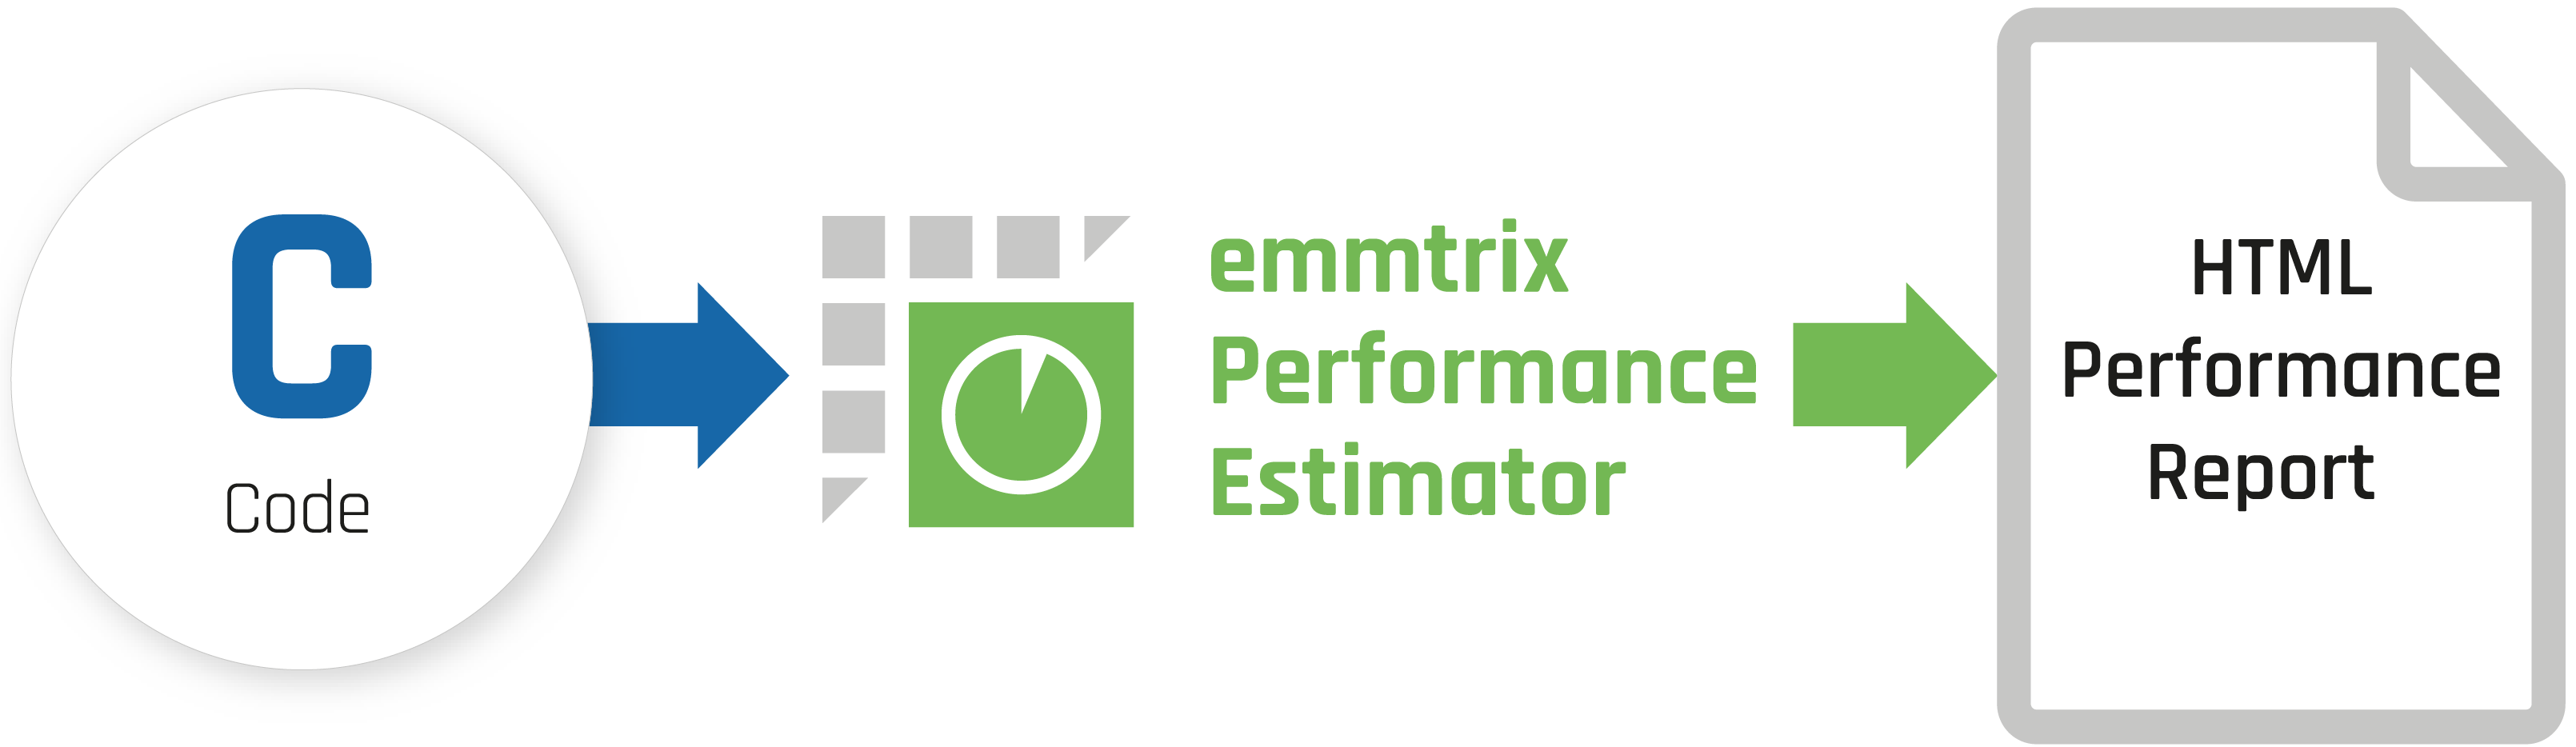
The typical workflow starts with the application code and the selected target platform. ePE analyzes the program structure and combines information about how often code is executed with the estimated execution cost on the target processor.
The resulting performance information can be inspected at different levels of the software and used throughout development.
How Static Performance Estimation Works
Static performance estimation predicts the runtime behavior of software without executing it on the target system. It analyzes the program structure and instructions to estimate the execution time on a given processor.
Frequency x Cost: The Core Idea
The estimation is based on the relationship:
Execution Time = Execution Frequency x Execution Cost
Execution frequency describes how often a code block is expected to execute. It is derived statically from elements such as loops, conditional branches, and function calls.
Execution cost describes the estimated cost of executing the corresponding code on the selected target. Depending on the analysis level, this can be based on C statements or on generated assembly code and a processor model.
Minimum, Maximum and Average Execution Times
ePE can estimate minimum, maximum, and average execution times.
For conditional control flow, assumptions about branch probabilities can be used where the actual execution frequency is not known. These assumptions can be adjusted to incorporate application-specific knowledge.
Refining the Estimation
Static execution frequencies cannot always be determined automatically. ePE therefore provides several ways to refine the analysis:
- Constant propagation across functions to derive values and resolve control flow, such as loop bounds
- Configuration data such as JSON, A2L, or DCM data to provide concrete values
- Manual specifications for loop bounds or probabilities where required
- Analysis of unknown values to identify inputs with a relevant impact on the result
- Host-level profiling data that can be used where empirical information is available
Processor-Level Analysis
For more detailed target-specific estimation, ePE can analyze generated assembly code and take compiler optimizations into account.
Processor models can include pipeline effects such as:
Fetch → Decode → Execute → Memory → Write
The mapping between C and assembly code can also be inspected to understand how source-level constructs are represented after compilation.
Instruction Fetch
FETCH
Instruction Decode
DECODE
Shift + ALU
EXECUTE
Memory Access
MEMORY
Register Write
WRITE
Intuitive Performance Visualization
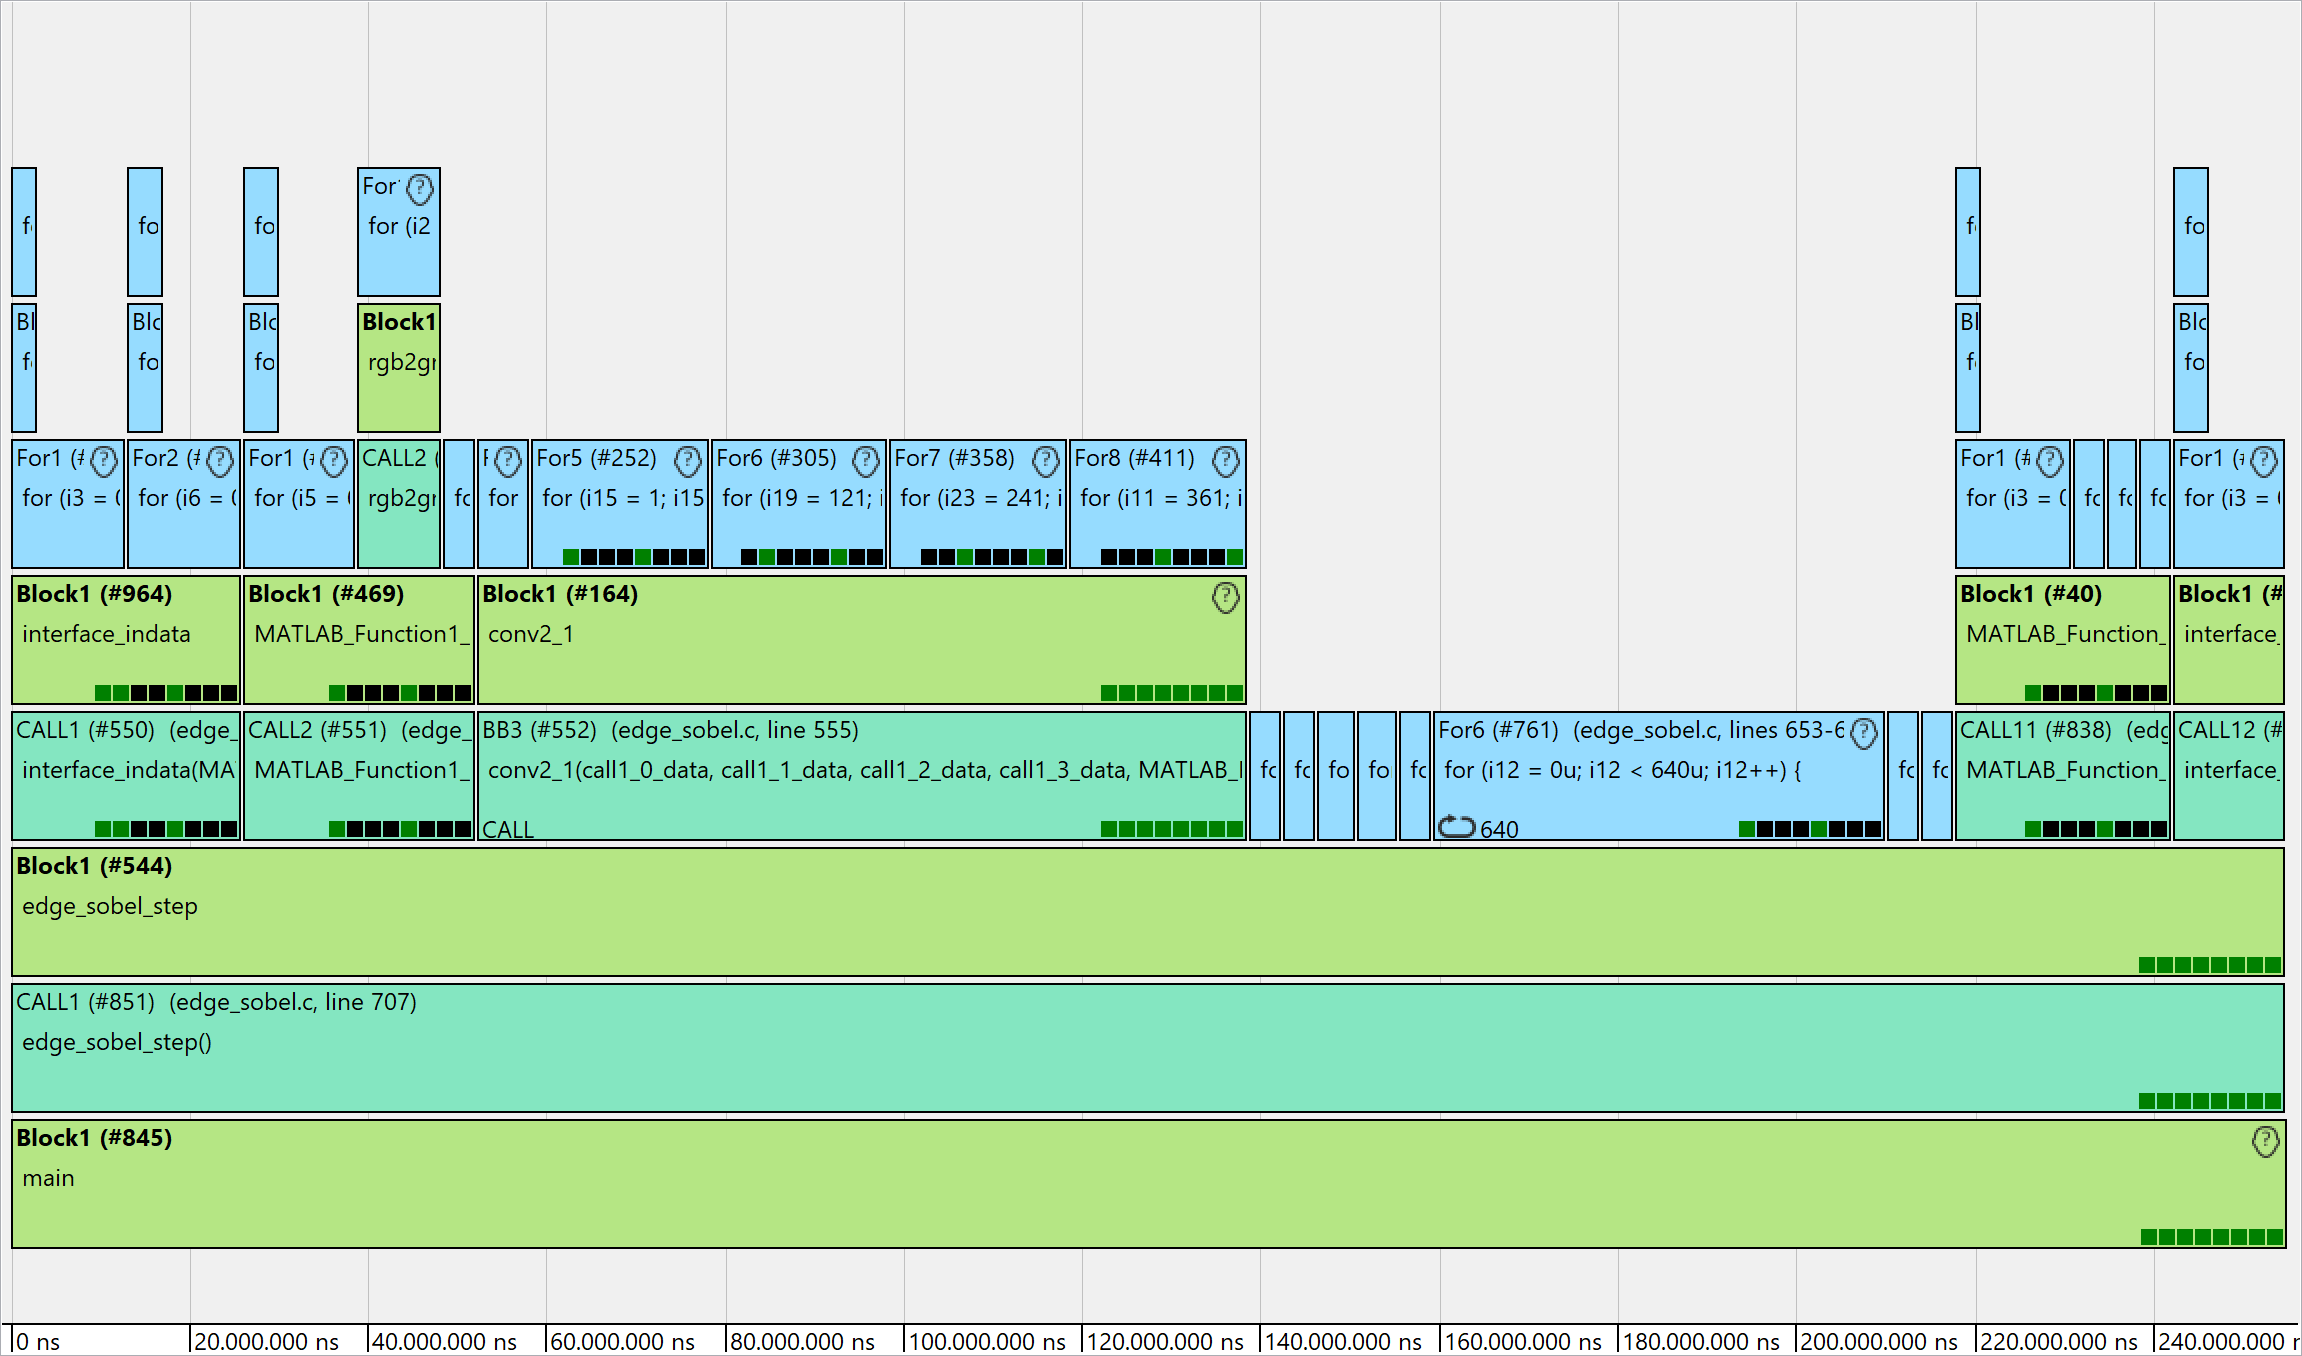
Figure 1: Visualization of the Performance Estimation
Results can be explored using an interactive, zoomable hierarchical program view. The X-axis represents the time, therefore the width of each block depends on the actual duration. On the Y-axis, the control structure of the program can be seen. Additional levels are added for structures like function calls, loops or conditions.
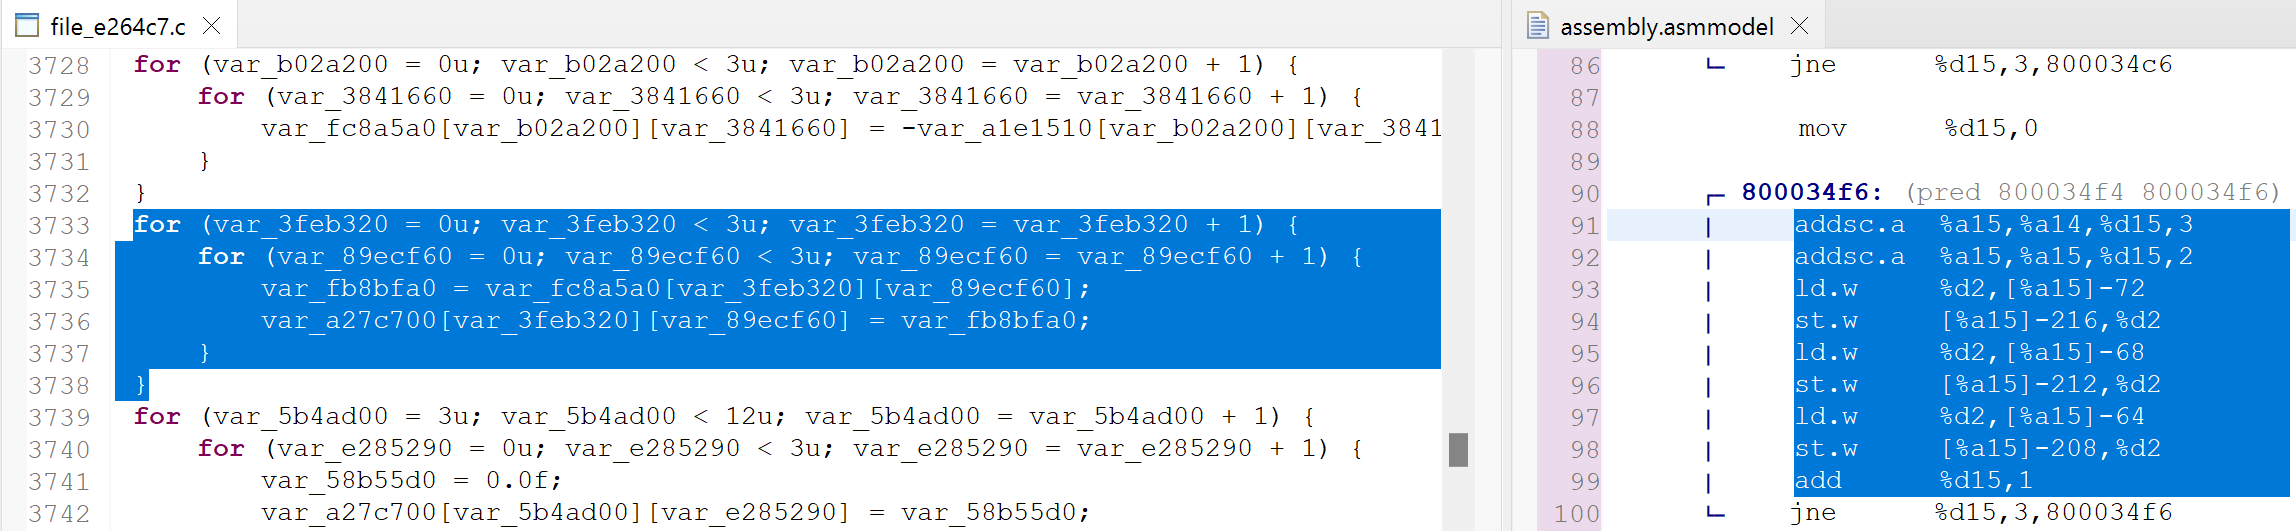
Figure 2: Analyzing Assembler Code
To enhance our static performance estimation solution, the emmtrix tools take applied compiler optimizations into consideration by analyzing assembler code. Together with a model of the processor pipeline, the actual timing behavior of the program on the selected hardware can be predicted with significantly higher accuracy. The advanced mapping between C and assembler code is accessed directly from the GUI and can be used for further inspection.
Key Features
- Automatic Reports and Visualization: Generate structured reports and visualizations that document estimated execution times, analysis assumptions, and results.
- Confidence Levels: Classify estimation results using confidence levels.
- Development Workflow Integration: Integrate performance estimation into existing development workflows.
- Fast Evaluation Across Target Platforms: Evaluate software performance for different target platforms.
- C- and Assembly-Level Performance Estimation: Perform static performance estimation based on C code or assembly code.
- Simulator and Hardware Profiling Integration: Integrate simulator or hardware profiling data into the analysis workflow.
Key Benefits
-
Analyze Performance Early: Estimate software performance before a complete HIL setup is available and use the results to support design decisions early in development.
-
Monitor Performance Throughout Development: Track performance changes across software revisions, identify performance regressions, and monitor timing budgets as the software evolves, including through integration into CI/CD workflows.
-
Compare Target Platforms: Compare estimated software performance across different or heterogeneous target platforms.
-
Understand Timing Behavior: Inspect detailed timing information at different levels of the application to understand where execution time is spent.
-
Identify Performance-Critical Code: Detect high-runners, hotspots, and other performance-critical parts of the software application.
-
Estimate Core Utilization: Estimate core utilization to support and optimize runnable or task-to-core mappings.
Some Supported Platforms
emmtrix Performance Estimator has already a wide range of supported target platforms ranging from general-purpose processors (e.g. ARM Cortex-A series or X86) to special-purpose microcontrollers (e.g. Infineon AURIX™ family). In general, the performance estimation can be easily adapted and customized to provide basic supoprt for new processor architectures. More complex and accurate hardware models with respect to the processor pipeline can be supported on demand.







Extension & Integration for ePE
Static timing estimation is most valuable when it integrates seamlessly into established embedded software development processes. The emmtrix Performance Estimator supports common engineering workflows without requiring a separate performance engineering process.
Simulink Performance Analysis
Analyze Simulink blocks directly within your model using ePE.
AUTOSAR Support
Analyze RTE and component code for run-time behavior in AUTOSAR environments.
TargetLink Extension
Integrate ePE with TargetLink workflows for precise analysis of production code.
CI/CD Workflow Integration
Use ePE in CI/CD environments for code-only or code/simulation (CO/CS) flows.
Technical Resources
Technical White Paper
Learn about the principles and application of static performance estimation for embedded systems.
Webinar
See how static performance estimation can be applied in an embedded software development workflow.
Tech Wiki
Explore technical documentation and further information about the emmtrix Performance Estimator.
Associated Partners

emmtrix Technologies is an Infineon Associated Partner with over 10 years of experience working with the Infineon AURIX™ microcontroller family and has been actively collaborating with Infineon for the past five years.
Frequently Asked Questions
What is the emmtrix Performance Estimator?
The emmtrix Performance Estimator (ePE) is a static performance analysis tool for embedded software. It estimates execution times from (embedded) C code and generated assembly using static program analysis and configurable execution cost models, providing timing insights before representative measurements on target hardware are available.
Does ePE replace runtime measurements?
No. Runtime measurements provide timing information for software executed under specific conditions. Static performance estimation provides analysis-based estimates without executing the application on the target system. The two approaches complement each other throughout development.
When is static performance estimation useful?
Static performance estimation is particularly useful when target hardware or representative test scenarios are not yet available, when implementation alternatives need to be evaluated, or when software performance needs to be monitored throughout development. It provides early visibility into software performance and complements later measurements on the target system.
Which execution time metrics can ePE estimate?
Depending on the selected analysis configuration, ePE can estimate:
- Minimum execution time, representing the shortest path through the application
- Average execution time, representing the typical expected execution time
- Maximum execution time, representing the longest path through the application
What input does ePE require?
ePE analyzes embedded C code and generated assembly. The available analysis depth depends on the project configuration and the selected execution cost models.
Can ePE be integrated into continuous integration workflows?
Yes. Static performance estimation can be integrated into automated development workflows to monitor software performance across revisions and help identify timing regressions during development.
Which processor architectures are supported?
Support depends on the available execution cost models. Public examples currently include Infineon AURIX™, Arm® Cortex®-M, Arm® Cortex®-A, Power Architecture®, Raspberry Pi, STM32, NXP i.MX, and Renesas R-Car. Additional processor support can be discussed based on project requirements.
Does ePE support AUTOSAR-based development?
Yes. ePE can be integrated into AUTOSAR-based development workflows to support timing estimation during software development.
What assumptions influence the estimation?
Static performance estimation provides analysis-based estimates derived from the software structure and the selected execution cost models. Actual runtime depends on the target hardware, system configuration, compiler settings, and runtime conditions. Representative target measurements remain essential for final validation.
Let's Get in Touch
We believe that the best solutions start with a conversation. Whether you are exploring static code analysis, performance estimation, or code optimization – we’re here to help you reach your goals faster and more efficiently.